MetaView is designed to greatly enhance your market awareness and streamline the process of researching individual companies by reducing the number of actions in your research workflow.

If you are like me you spend a lot of time browsing the web, sifting through the vast amounts of information out there, finding out what people are up to, and keeping an eye open for good investment opportunities.

I've spent a lot of time on various sites that offer free financial news and information, but at a certain point, I realized that one could spend a lifetime looking at stocks one at a time. I wanted more of a bird's eye view of the big picture. At the same time, I wasn't ready to sign up for any financial news or data services that cost hundreds or thousands of dollars per month.

So I developed MetaView to work with an inexpensive data feed, to allow me to view entire markets at a time and to help answer certain questions I had that I couldn't easily answer previously, such as:

• What stocks parallel each other and under what conditions do they diverge?

• What stocks are dependent on others?

• To what degree do news stories affect stock prices, and do the prices change before or after the stories get published?

• Are there certain historical events that move entire markets simultaneously?

Every now and then I used to find out that some stock I wasn't even following was doing something really dramatic and wished I'd known about it earlier. 
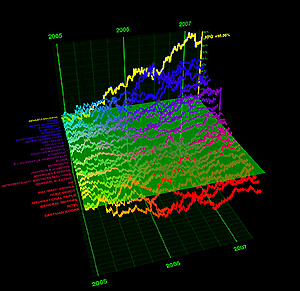
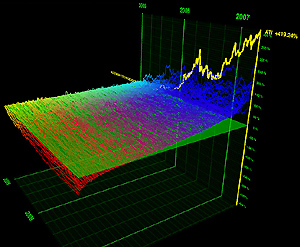
I decided that if I could see large numbers of stock charts simultaneously, then I would be more likely to be aware of dramatic movements that much earlier.


Currently MetaView does the the following:


• You can create groups of stocks to view in 3D, if you enter the number of shares you have of each it will calculate the total value and display it in the main view.

• When you are viewing a particular stock in MetaView you can use a menu to jump to view more information about that stock at any of the free financial news sites out on the web.

• You can then save headlines (and URLs) for news stories for each stock and graph when they were published on the price graph.

• You can also access SEC filings and graph them by date.

• You can enter historical events and assign them to various groups, they will then be displayed as labels on the reference grid behind the stock charts.

• MetaView has a speech sythesis function that can give you an audible summary of each stock in a group as it automatically cycles through them.

• MetaView comes with a screensaver that shows the same view as the main window. It's eye catching and entertaining, as well as being informative, and tends to draw a lot of attention from friends and coworkers. The speech synthesizer can also be turned on and off while in screensaver mode.


• MetaView automatically downloads data for the U.S. market. You can schedule when this happens or use the default schedule. Because data is stored on your local hard drive rather than the net, access is very fast, and you can still use most of its functionality when you have no net connection.

MetaView is intended to complement the financial resources available on the web. In addition to its 3D market visualization capbabilities, it provides a hub for storing and organizing the information involved in your stock market research.

MetaView is currently available for systems running Mac OS 10.4 and higher. A PC version will be available soon. You can request to be notified when the PC version is available by clicking here.


Copyright © 2007 Group Mind Creative Computer Consulting, Inc. All rights reserved.